ChemLab Procedures
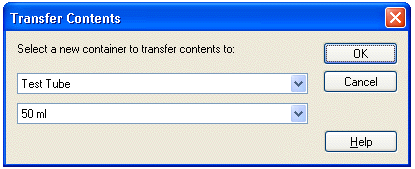
ChemLab tries to create the feel of performing an actual lab by taking into account the position of certain lab equipment relative to other lab equipment. This is seen in decanting, or pouring, titration and heating with the bunsen burner.
Pouring or decanting, involves selecting a piece of lab equipment, positioning its left side over the receiving container and selecting the decant button from toolbar or decant/pour menu item from the procedures menu or from the right-mouse-button context menu. Note: liquid is first transferred in this process, to allow separation.

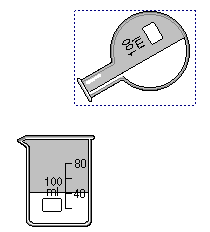
Similarly to heat an object with a bunsen burner, position the burner under that object.
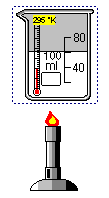
Set Gas Syringe Volume : is a procedure to change the volume of the Gas Syringe with Gauge by depressing or releasing its plunger. When selecting the syringe and choosing Set Gas Syrine Volume from the Procedure menu or the Right-mouse button context menu, the new Syringe Volume is entered in the dialog box, which then calculates the new combined Total Volume of the syringe and fittings. Note: this procedure does not work for the Gas Syringe Sealed.
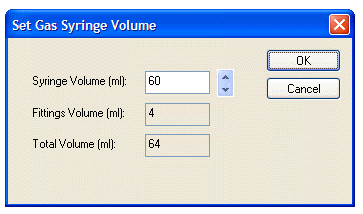
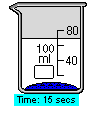
Timer : is a procedure to attach a clock to a specific piece of lab equipment that records elapsed time in seconds.
To add a timer, highlight the piece of equipment and select Start Timer menu from under the Lab Procedures menu or from the Right-mouse button context menu. A timer can be stopped using the Pause Timer menu option and started again using the Resume Timer menu option. The Reset Timer menu option sets the clock to zero. The Close Timer menu option removes the clock from the highlighted piece of equipment.
Note: The clock displays time elapsed within the simulation. It does not display the actual time elapsed. In ChemLab the simulation will stop running momentarily while a modal dialog box is open, while a popup menu is open or while the mouse button is held down.
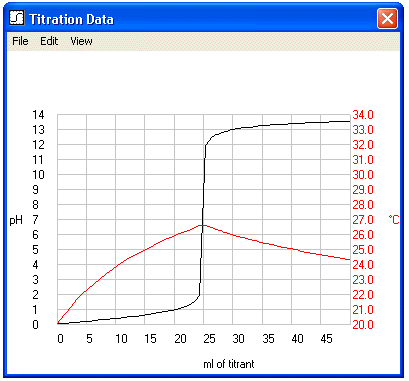
Titration Curve : is a procedure for collecting acid-base titration data and plotting pH versus titrant volume on a curve. The results are not saved in a LAB file but maybe copied to the Observations window or saved as a csv file. These features can only be used with labs that calculate pH. (See pH Meter for a description of pH.)
Data is collected from a container. To initialize the container, highlight the object and select Collect Titration Data from the Procedure menu or the Right-mouse button context menu. (Note: data can be collected for only one object at a time. To collect data for another object, the original data must be dropped. A dialog box will prompt the user when initializing a new container or re-initializing the original container.)
During or after performing the titration, select View Titration Data from the Procedure menu or the Right-mouse button context menu. The Titration Data window will appear containing a plot of the titration curve. The Titration Data window can be opened at any time. Its default is to automatically refresh the curve as data is collected. If automatic refresh is not set in Options… under the Edit menu, the Refresh option under the View menu must be used to update the display. When the window is resized, the graph will be resized automatically. The data remains collected even after the container is emptied or deleted. Data are erased when the Collect Titration Data procedure is re-initialized.
The Titration Data window contains the following menus:
(1) File contains Export to csv file... This will create a comma-delimited file that can be opened by a spreadsheet application.
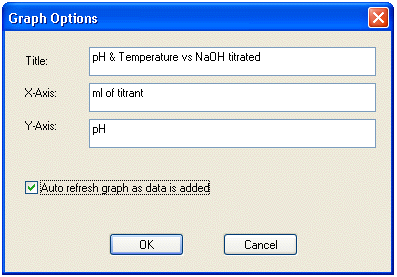
(2) Edit contains Copy and Options... Copy will place the current contents of the window to the clipboard. If the window contains the graph, a bitmap will be copied. If it contains data, selected text data will be copied. Options… (see below) is used to set the graph title as well as legends for the x-axis and y-axis. It also enables the user to disable the default for automatically refreshing the display upon data collection.
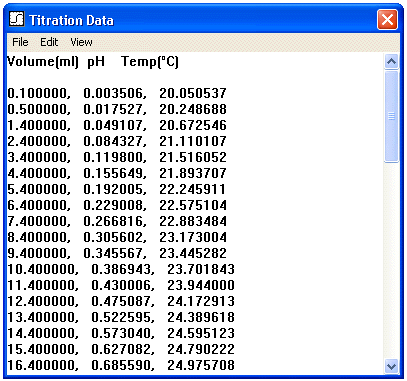
(3) View contains Graph, Data and Refresh. Graph displays the titration curve (below top) in the window, Data displays the collected raw data (below bottom) in the window, and Refresh updates the data/curve from when the window was opened or from the last Refresh.
Transfer to New Container : is a procedure to transfer the contents of a piece of equipment or a container to a new container by selecting the object and choosing Transfer to New Container from the Equipment menu or the Right-mouse button context menu. Choose a new container from the dialog box shown below.
